 As both a road cyclist enthusiast and a passionate e-commerce developer, I found myself analyzing cycling websites while shopping for bike parts.
What started as casual observations about website performance and technology stacks turned into a comprehensive data collection project.
This report examines the technical landscape of cycling e-commerce stores, analyzing their performance metrics and technology choices.
Drawing from my dual perspective in cycling and web development, I've selected the most important findings to provide valuable insights into the digital side of the cycling industry.
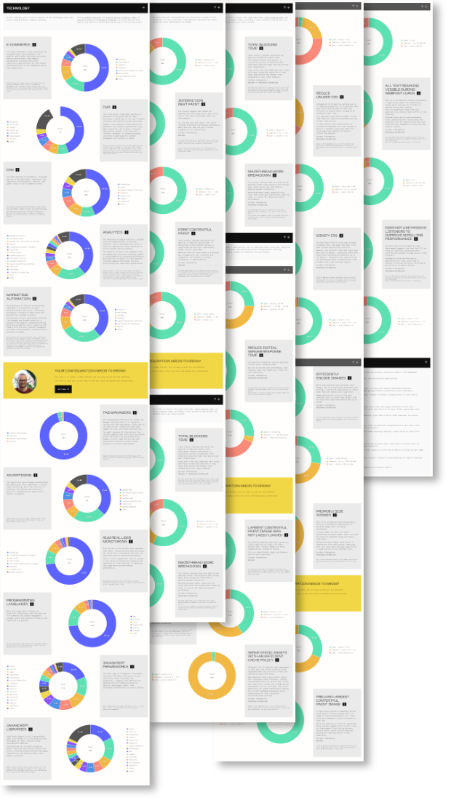
Matthias WalterHere is an overview of the key metrics and numbers extracted from the analysis of 250 cycling e-commerce stores and websites worldwide.
Offering a snapshot of our findings such as platform usage, website performance, and technology adoption across the industry.
while the remaining 49% use diverse platforms.
with 11,2% using more than one provider.
16% are even using more than one analytics tool
to automate marketing through
LCP = largest contentful paint
to track live user experience data
Render blocking resources increase render time and thus wait time for the user
minified javascript could increase the user experience with minimal effort
their pagespeed by lazy loading offscreen images

We have analysed more than 250 websites from manufacturers and brands in the cycling sector.
The report consists of more than 40 metrics from technology stack, core web vitals and pagespeed performance.
After signing up, you will receive an email with the link to the full report.