INP (Interaction to Next Paint) is one of the Core Web Vitals metrics and a critical signal for measuring how users actually experience your site. Unlike metrics that focus on loading or stability, INP reflects responsiveness over time. It measures how long it takes for the page to visually respond after a user interaction, like a click or a tap.
If you've ever clicked a button and felt like nothing was happening for what seems like an eternity, you've experienced poor INP. And the truth is, many websites are slower here than they realize.
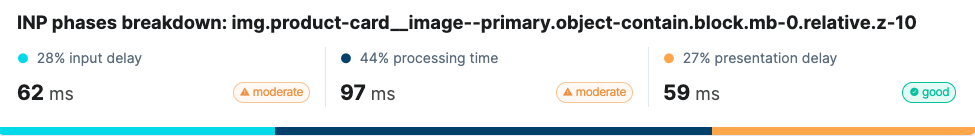
Let's break down the moving parts of an interaction, sometimes visualized as whiskers in DevTools:
Each phase needs its own optimization strategy:
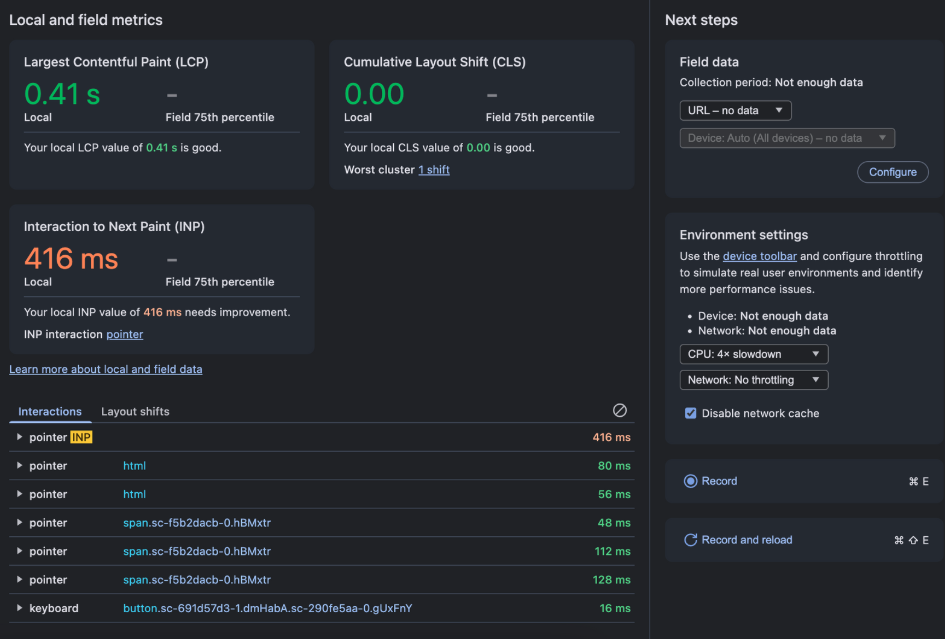
When starting an INP debugging session, Chrome DevTools is your friend:
This gives you a clear local picture, but it doesn't tell you what your real users are experiencing.
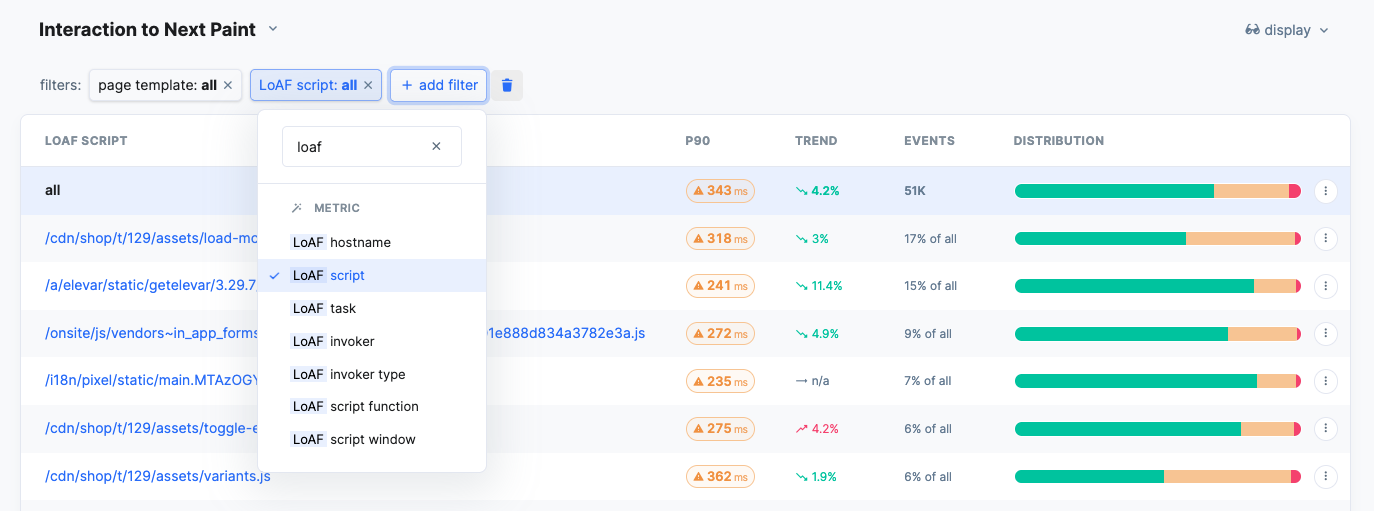
That's where Real User Monitoring (RUM) tools come in. For example, RUMvision explains how to use LoAF (Long Animation Frames) to connect what you see in the lab with what's happening in the wild.
While Chrome DevTools only shows you file sizes of third party scripts, LoAF reveals their impact on responsiveness which is a much more useful perspective. This helps prioritize whether that analytics or chat widget is dragging your INP score down for actual users.
As the RUMvision team puts it, INP debugging isn't just about spotting what is slow, it's about knowing what matters most to your users and tackling it in the right order.
Debugging INP can feel overwhelming at first. Every millisecond of delay can come from a different part of the interaction pipeline. But by combining DevTools for local deep dives and RUM data (with LoAF) for real world validation, you can uncover the true bottlenecks hurting your users.
The goal isn't to chase a perfect score, it's to make your site feel fast and responsive where it matters most. Because in the end, a snappy site isn't just better for Core Web Vitals, it's better for your users.
This is a guest post by Jordy Scholing, Co-owner & Customer Success Lead at RUMvision. Learn more about Real User Monitoring and performance optimization at RUMvision.
Let's discuss with David how we can help you improve your website's performance and user experience through expert performance optimization.